Market Explorer
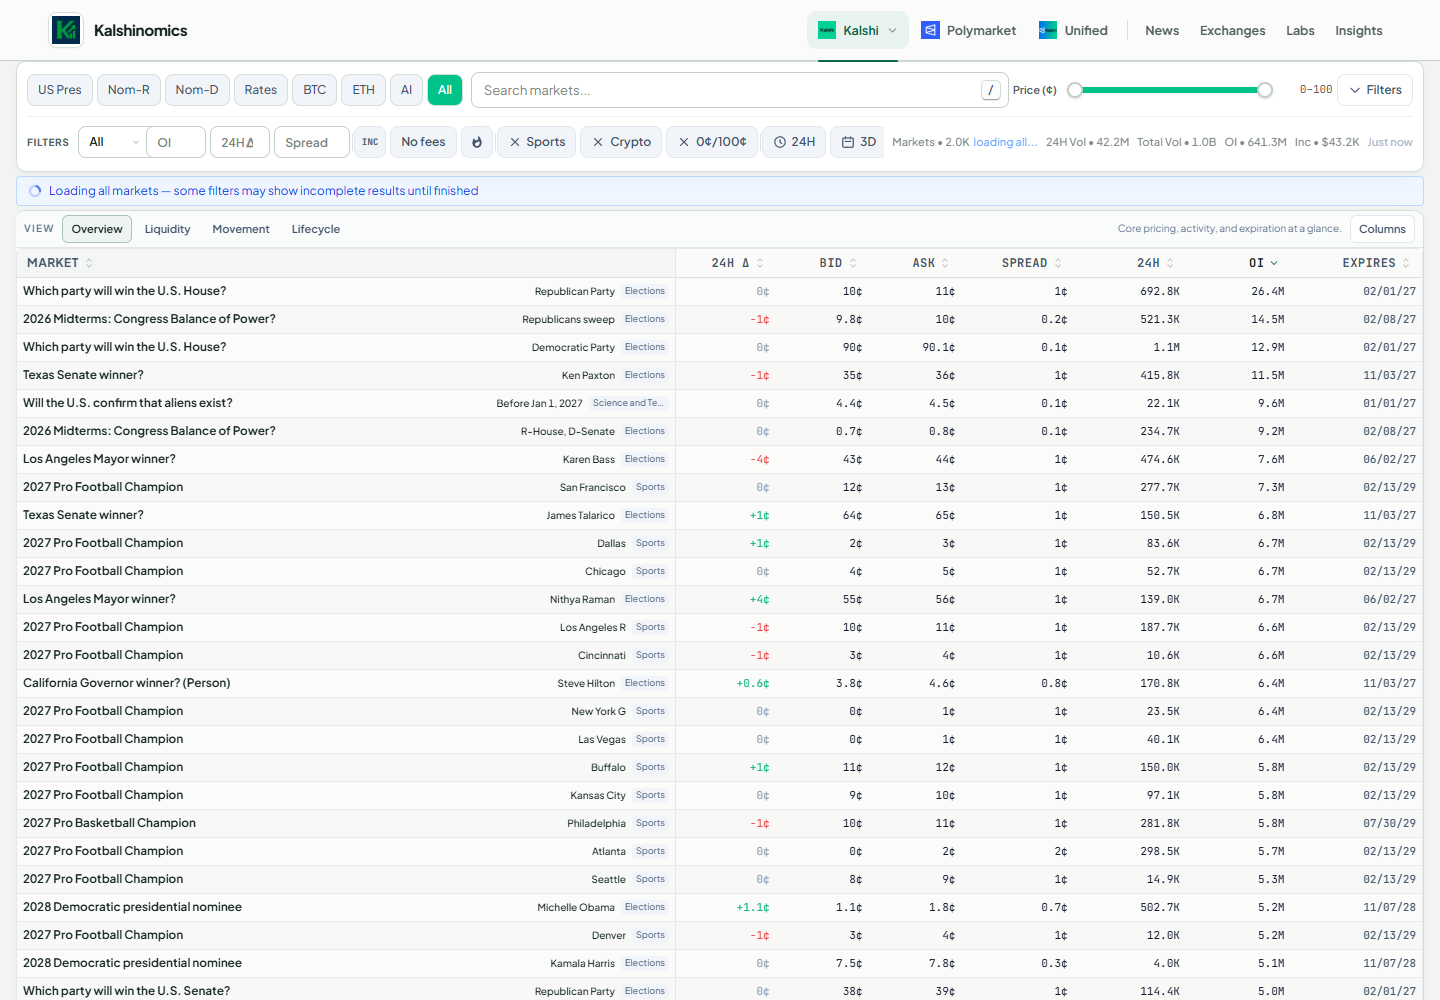
A searchable contract table with price, spread, volume, open interest, and expiration filters. Different table views helped users inspect pricing, liquidity, and market moves.
View full screenshot ↗ Kalshinomics
Follow on X
Kalshinomics brought prediction-market prices, activity, and research into one place. We built tools to help traders compare markets and understand what was changing.
Static screenshots of the site and its earlier versions. Prices and figures reflect each capture, not current market data. Open any image to see the full screenshot.
Put Kalshi and Polymarket prices side by side, with price gaps and trading activity in the same view.
Bring volume, open interest, and price history together to add context to market moves.
Turn market data into readable reports covering leading markets, categories, and unusual activity.
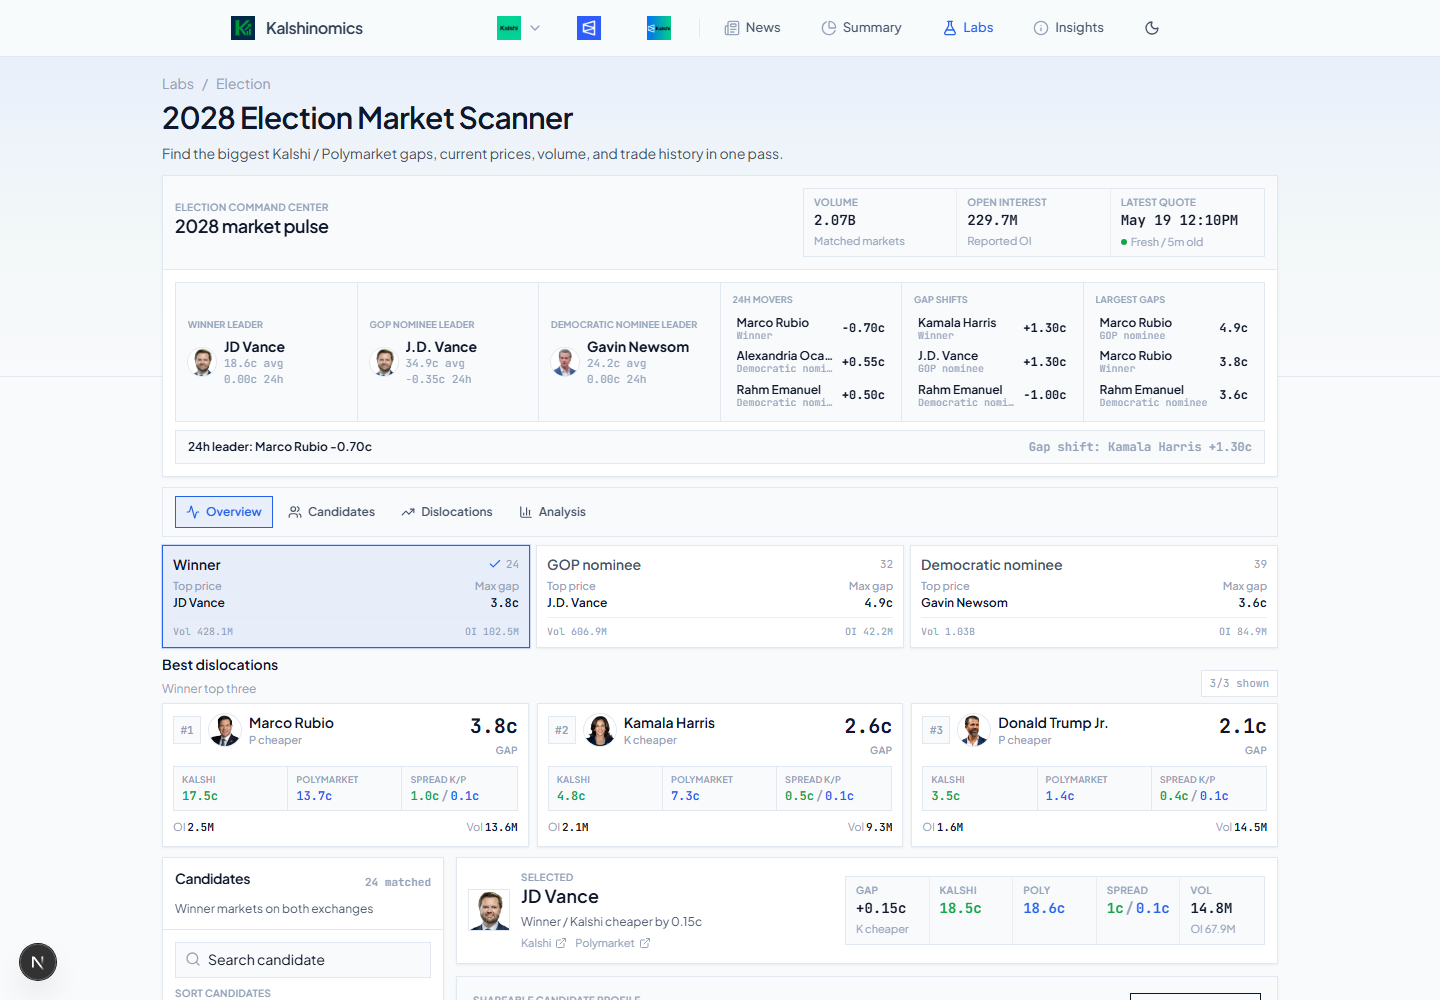
A focused view of election markets across Kalshi and Polymarket. It brought candidate prices, price differences, volume, and open interest together so users could compare related markets without switching between exchanges.
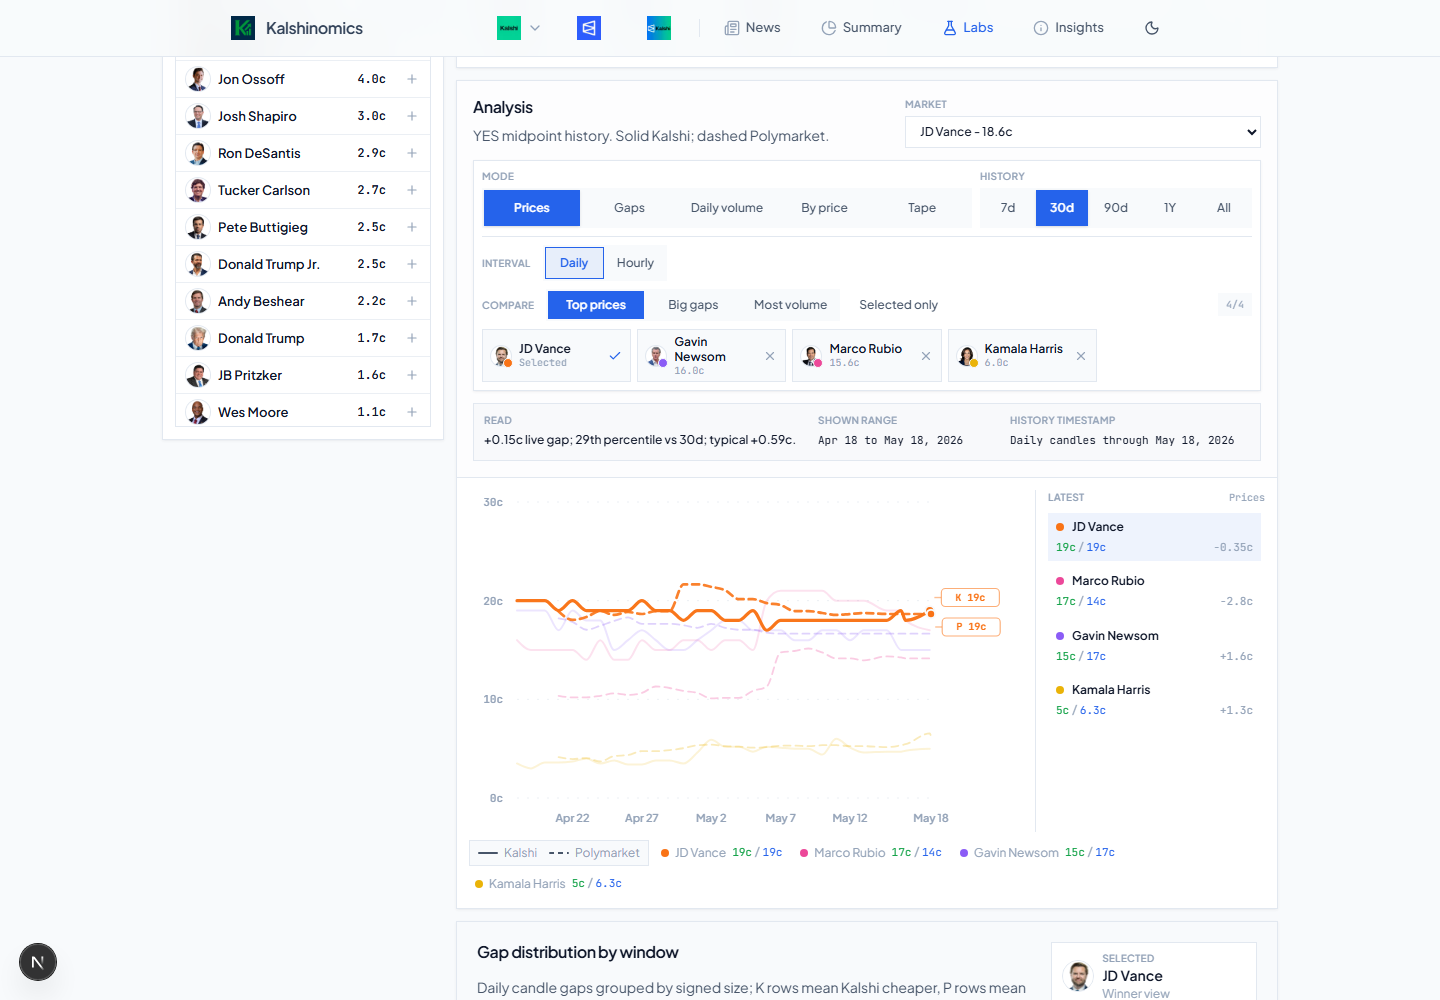
Charts let users compare candidates and exchanges over time. Price, gap, volume, and trade views helped users look beyond a single quote and see how markets had moved.
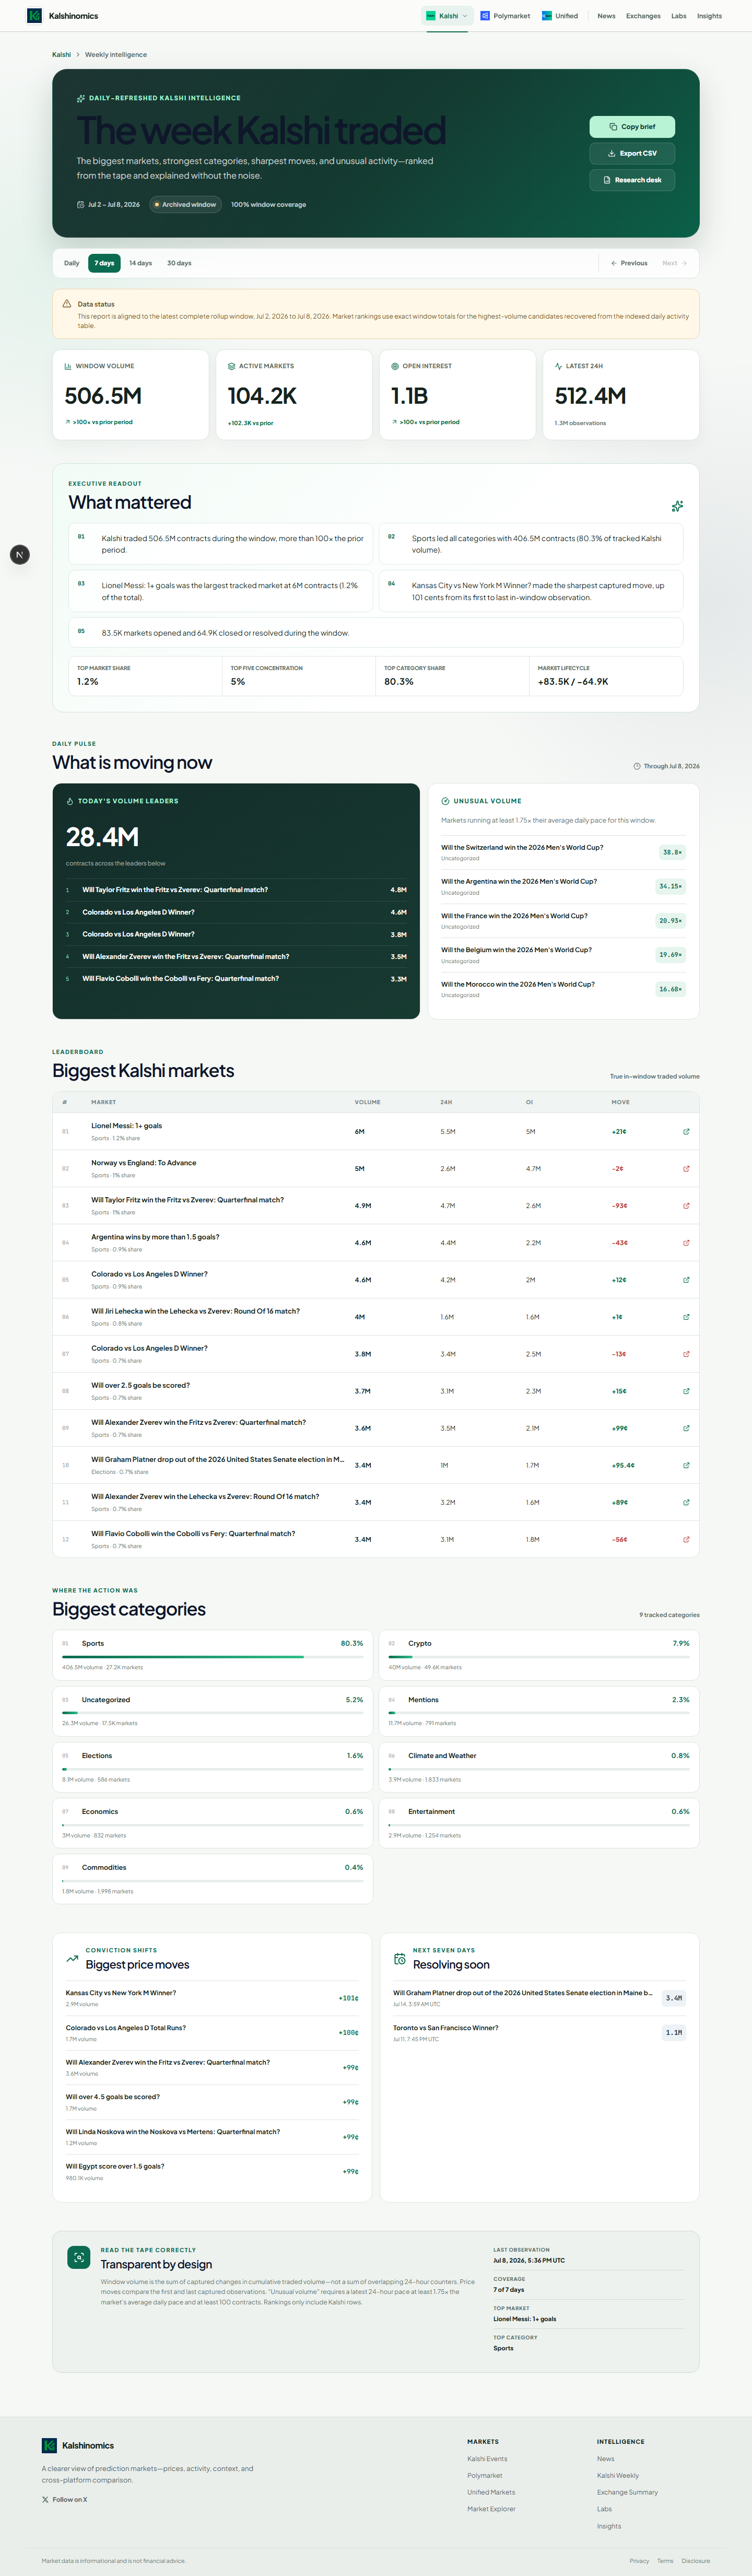
A report that brought the week’s largest markets, leading categories, price moves, and unusual activity into one readable summary. It gave users a starting point for research, with tables and data notes for more detail.
A searchable contract table with price, spread, volume, open interest, and expiration filters. Different table views helped users inspect pricing, liquidity, and market moves.
View full screenshot ↗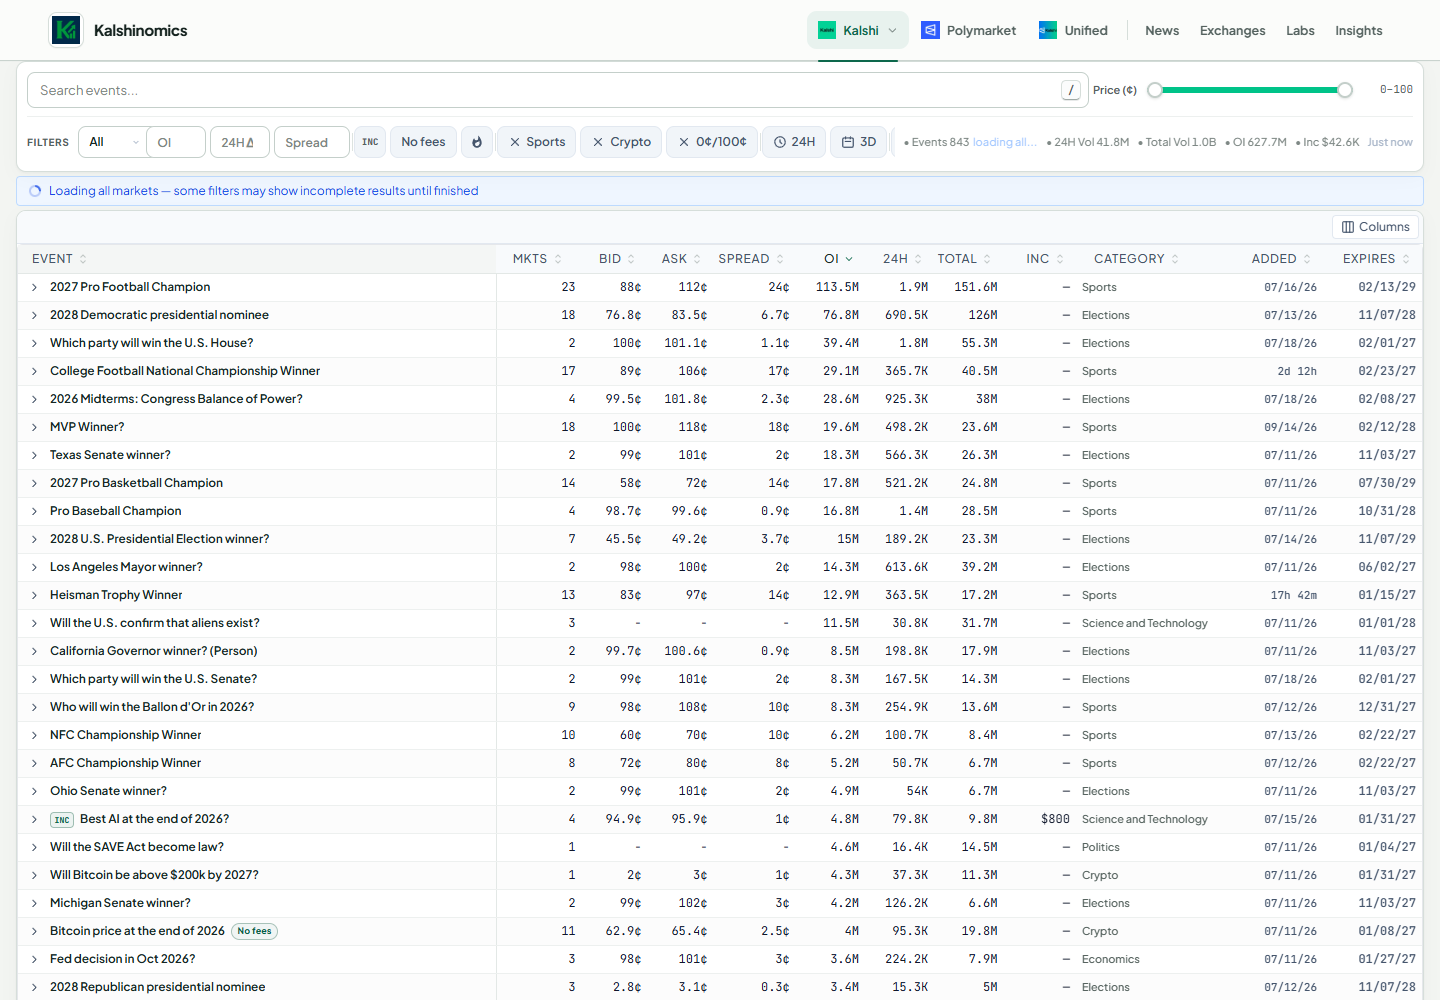
Grouped related contracts by event, with expandable rows and filters for categories, incentives, fees, prices, and trading activity.
View full screenshot ↗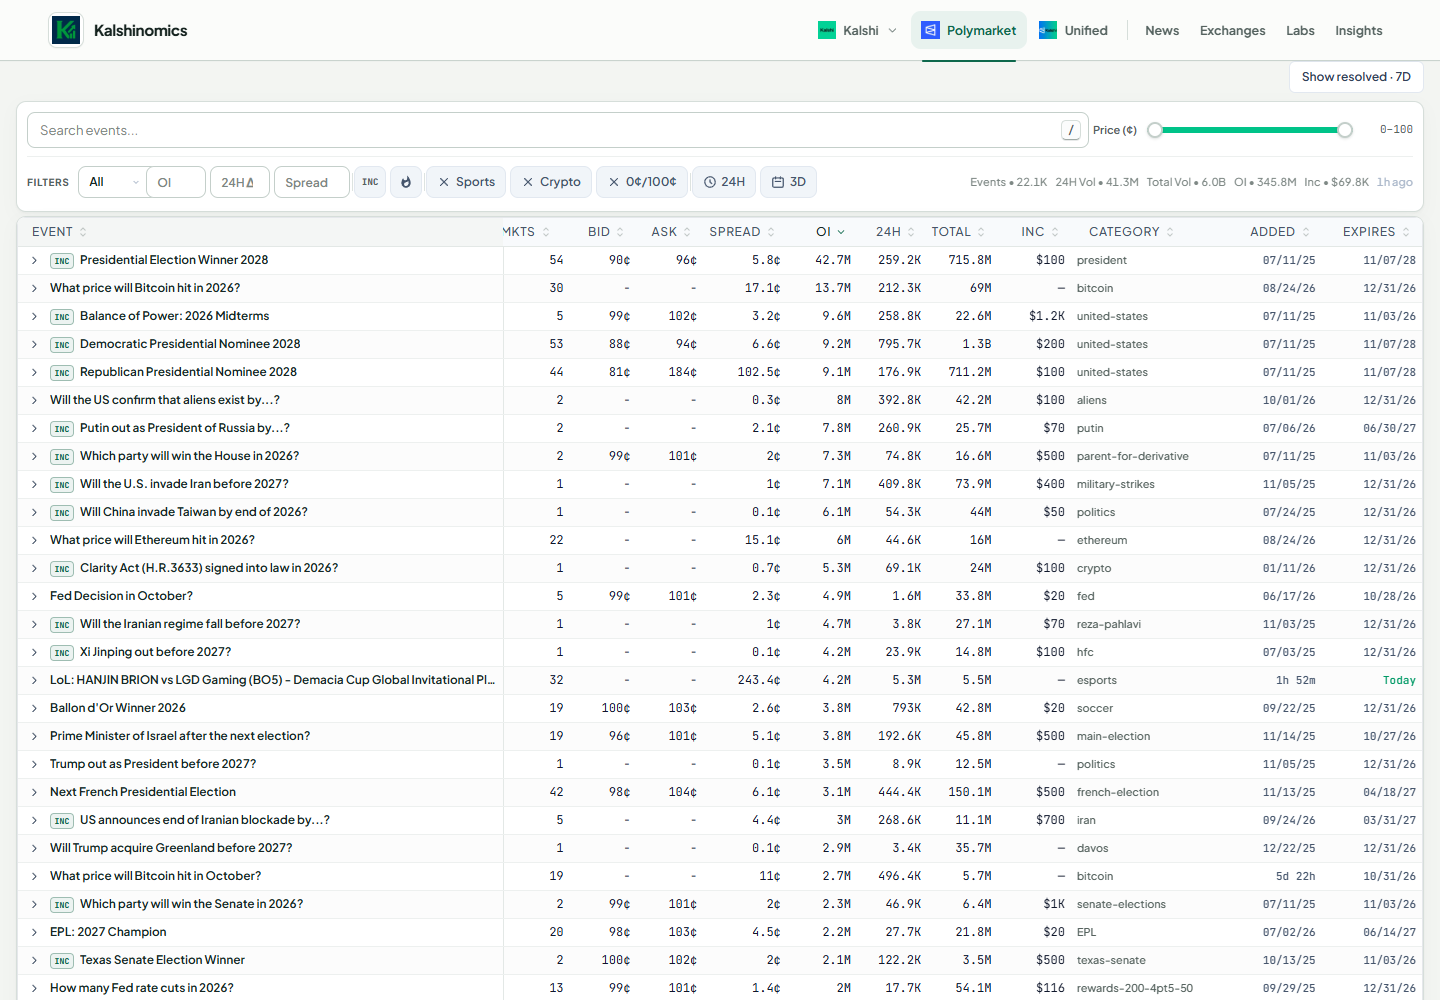
Brought Polymarket events into the same table format, so users could search questions and compare prices and activity with familiar filters.
View full screenshot ↗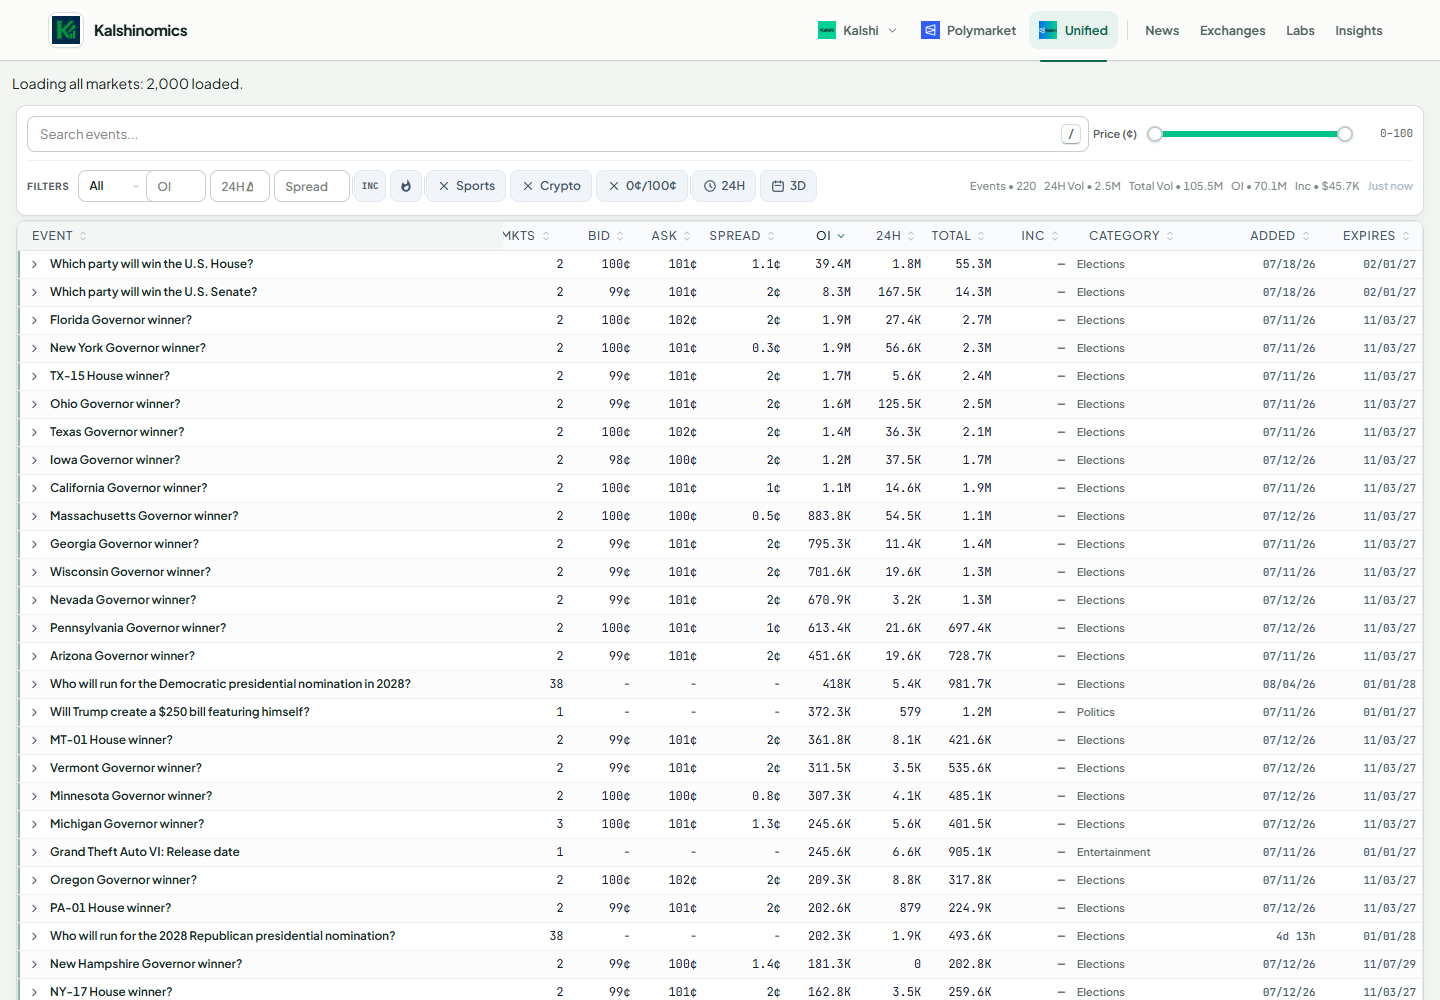
Combined events from both exchanges in one searchable view. Users could review market coverage and activity without moving between separate tables.
View full screenshot ↗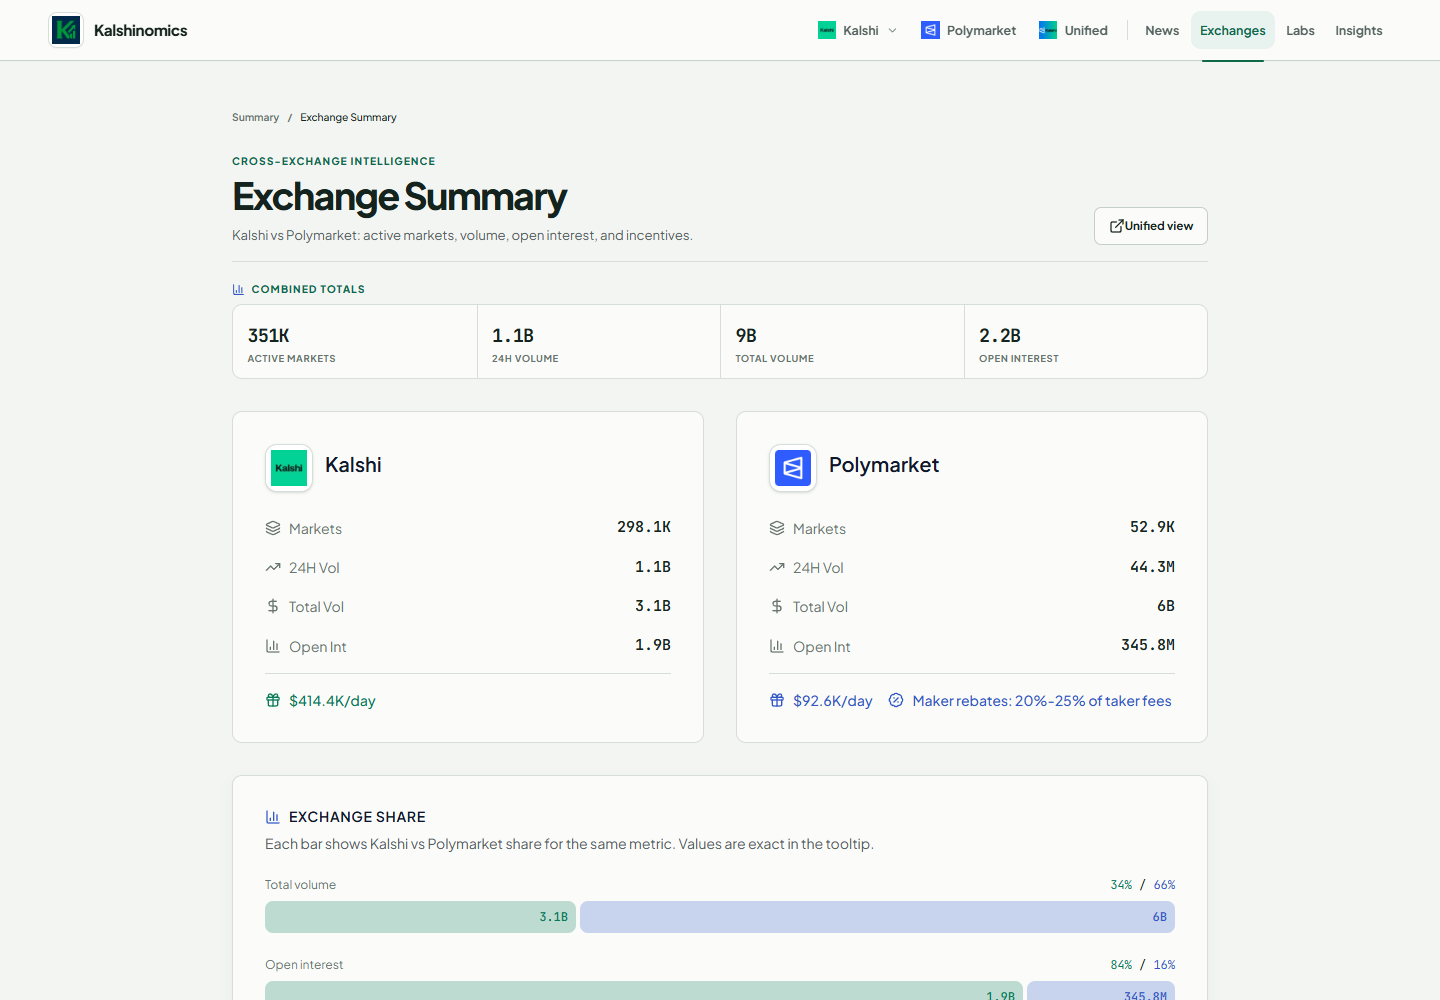
Compared market counts, trading volume, open interest, and liquidity incentives. Exchange shares and category breakdowns gave users a view of the wider market.
View full screenshot ↗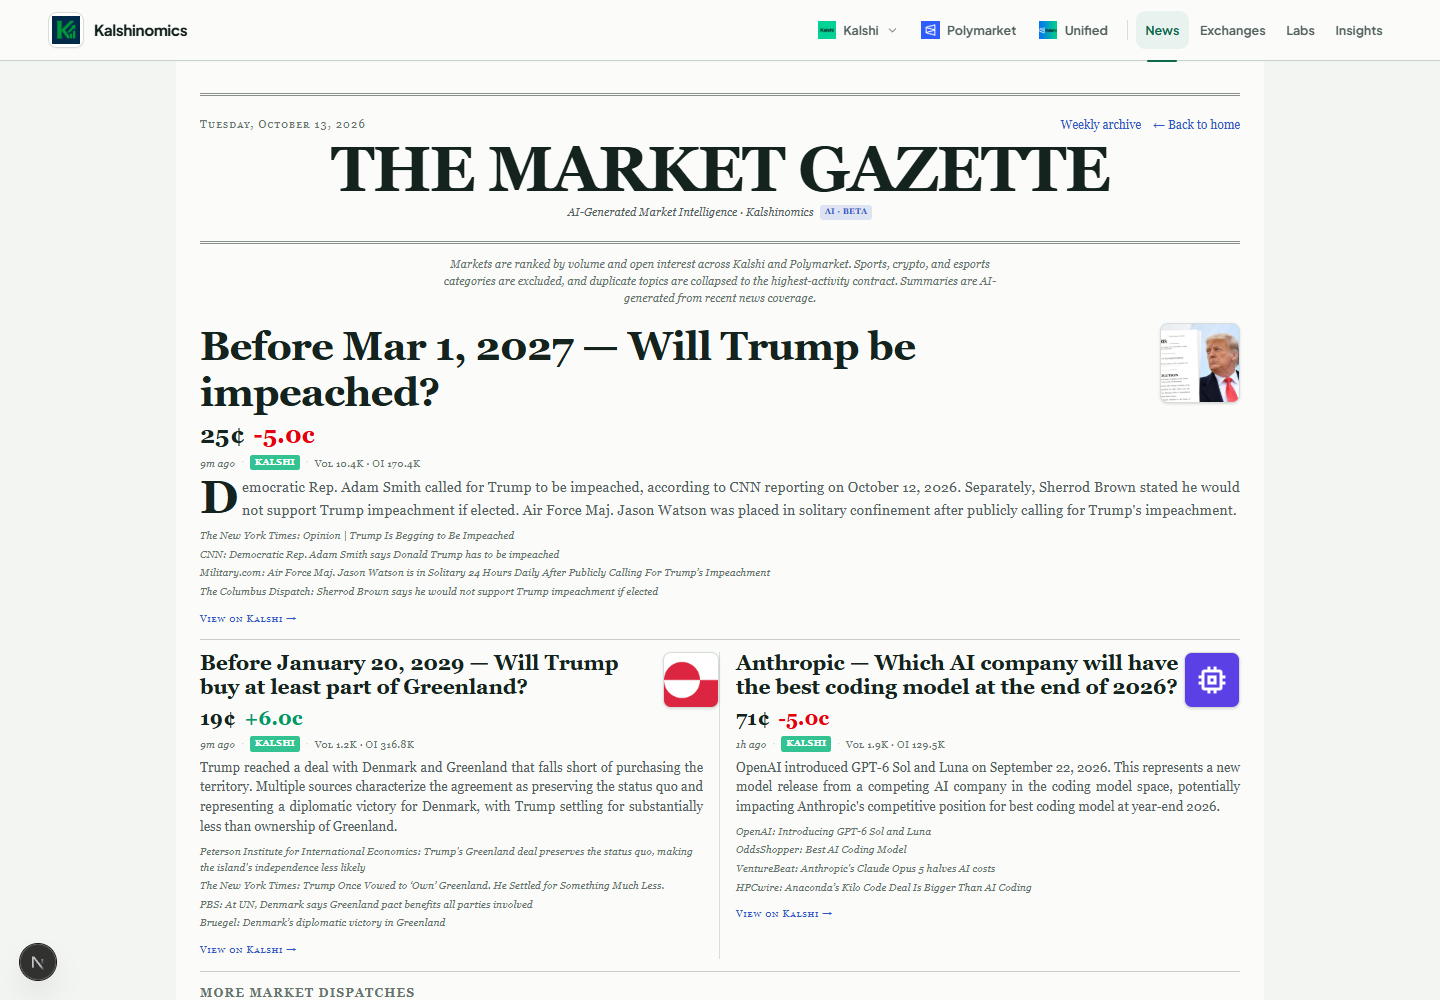
Connected active prediction markets to news coverage, with AI-generated summaries, market prices, price moves, and links to the underlying reporting.
View full screenshot ↗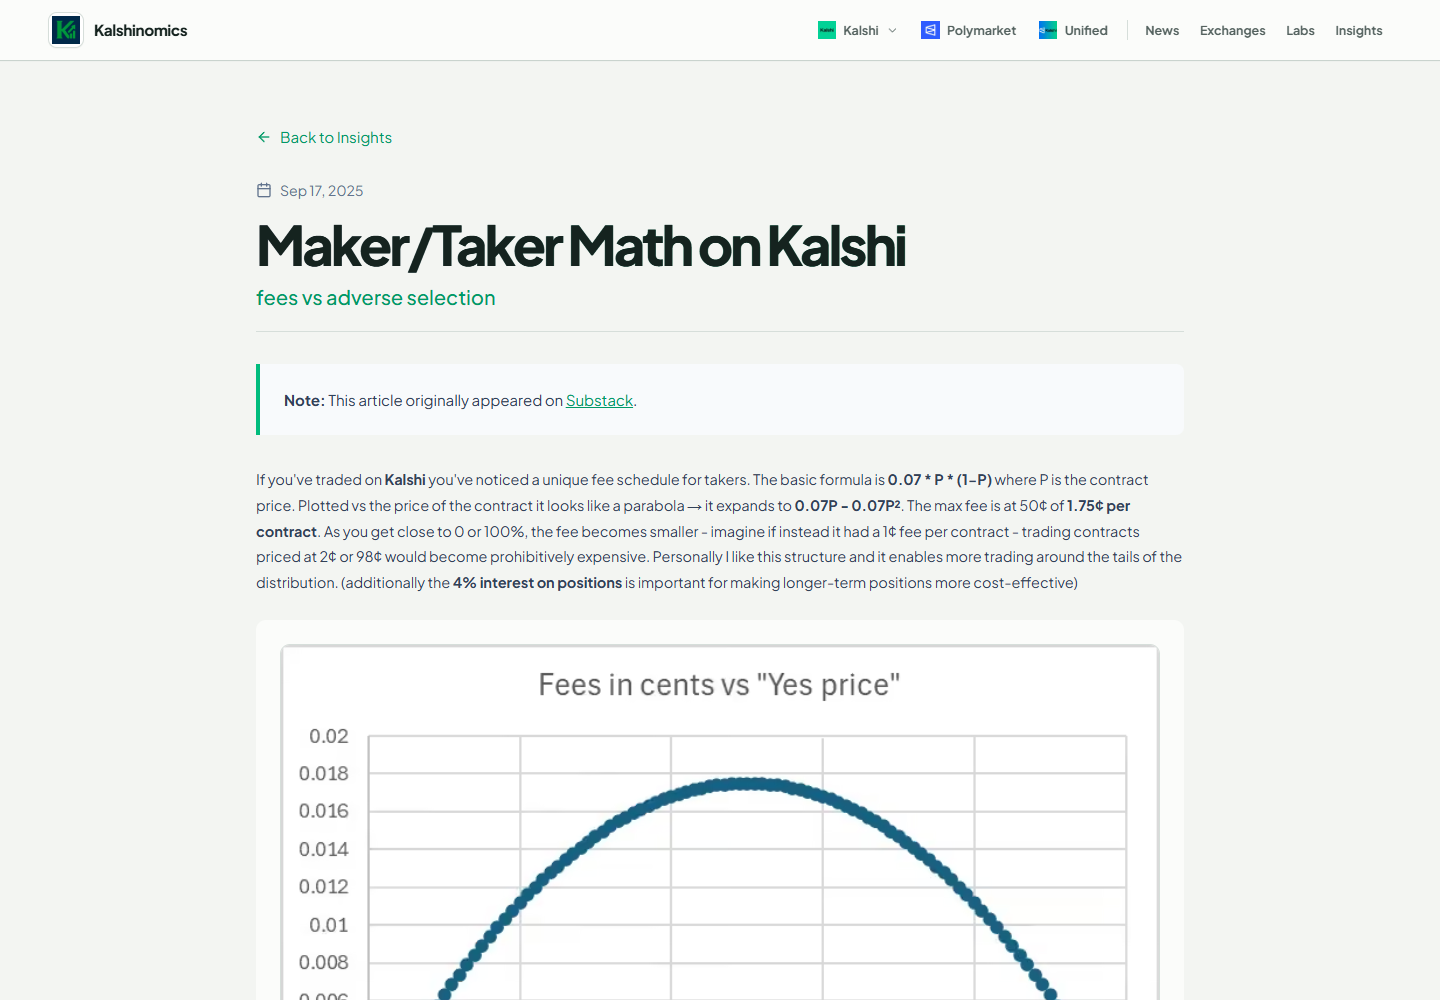
Published essays and charts about prediction-market mechanics, fees, adverse selection, and resolution. The goal was to explain the rules and trade-offs behind the numbers.
View full screenshot ↗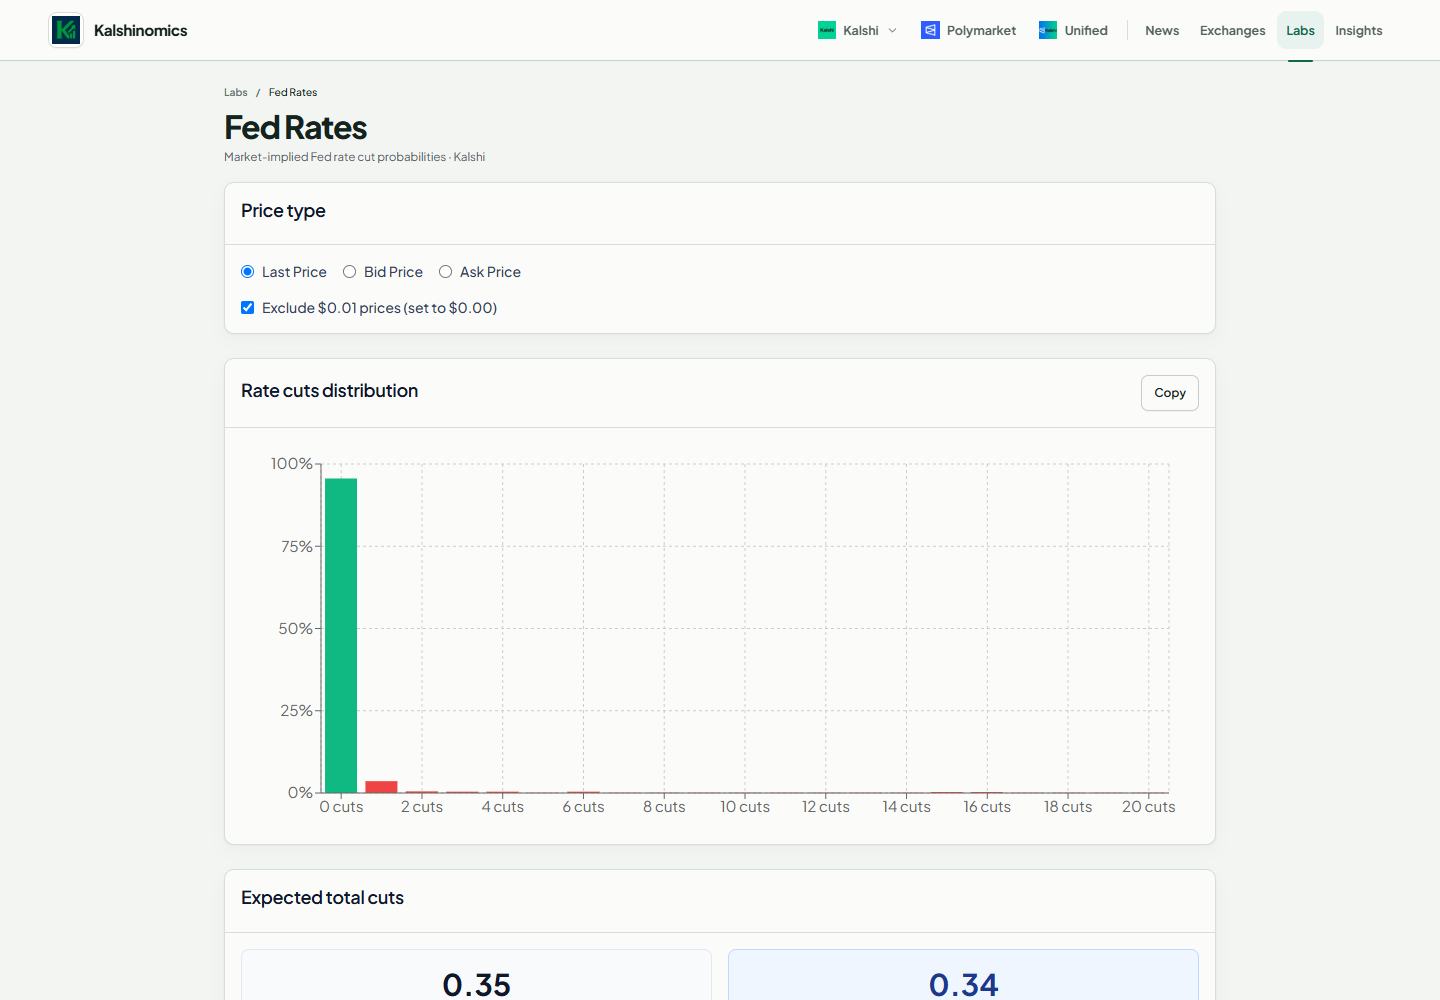
Turned rate-cut market prices into a probability distribution and expected cut totals. Users could compare last, bid, and ask prices to inspect the market structure.
View full screenshot ↗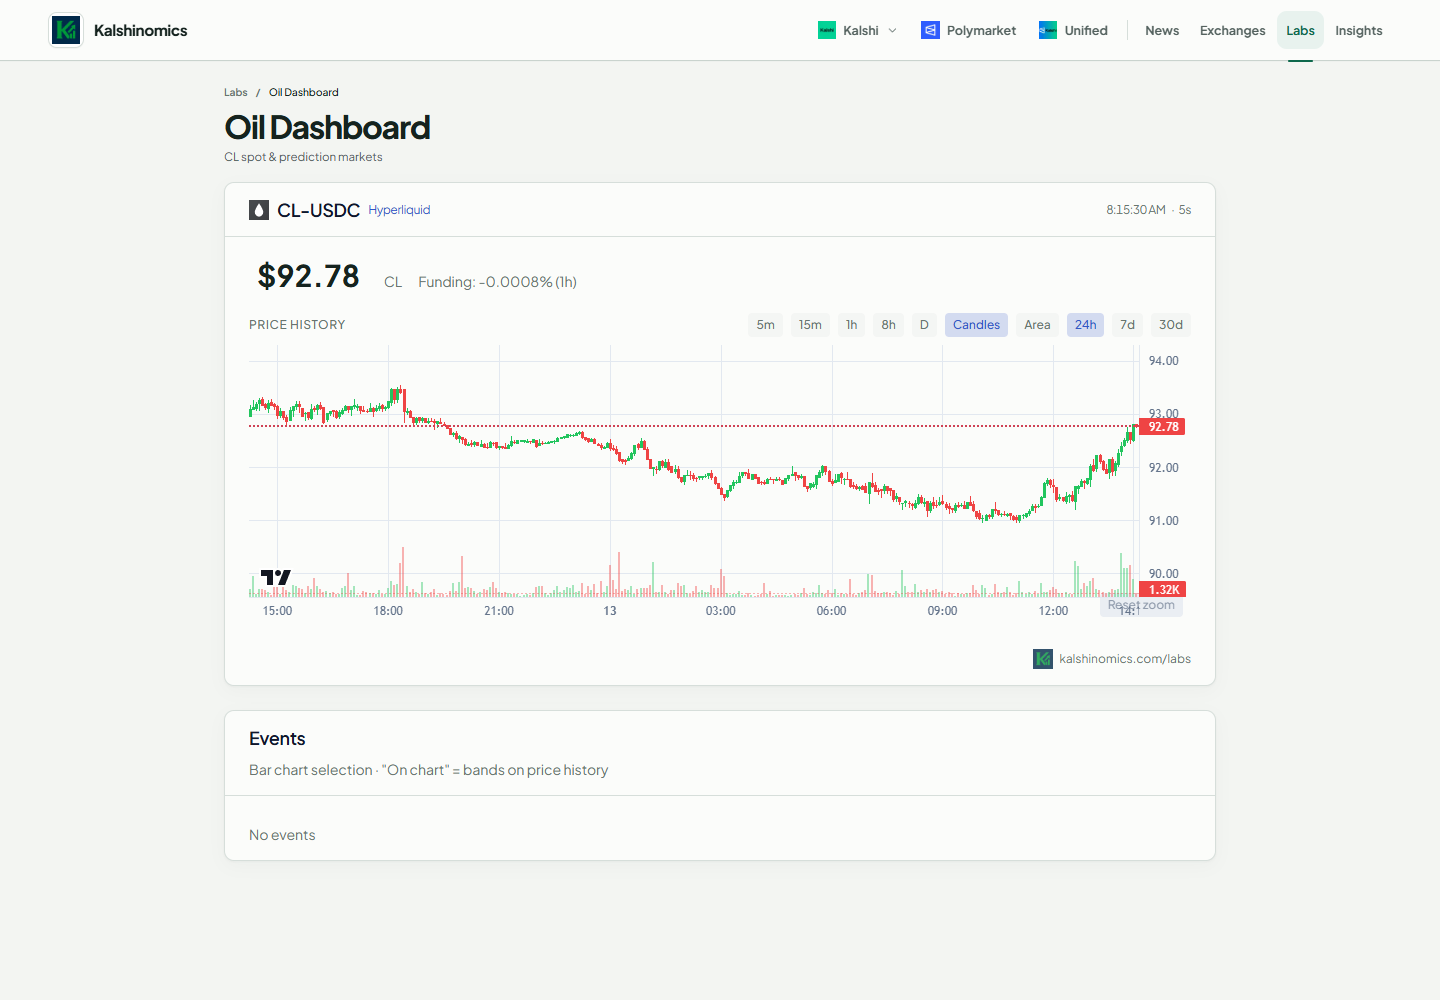
Put crude oil price history beside prediction-market events. The view was built to compare the underlying price with the outcomes priced by traders.
View full screenshot ↗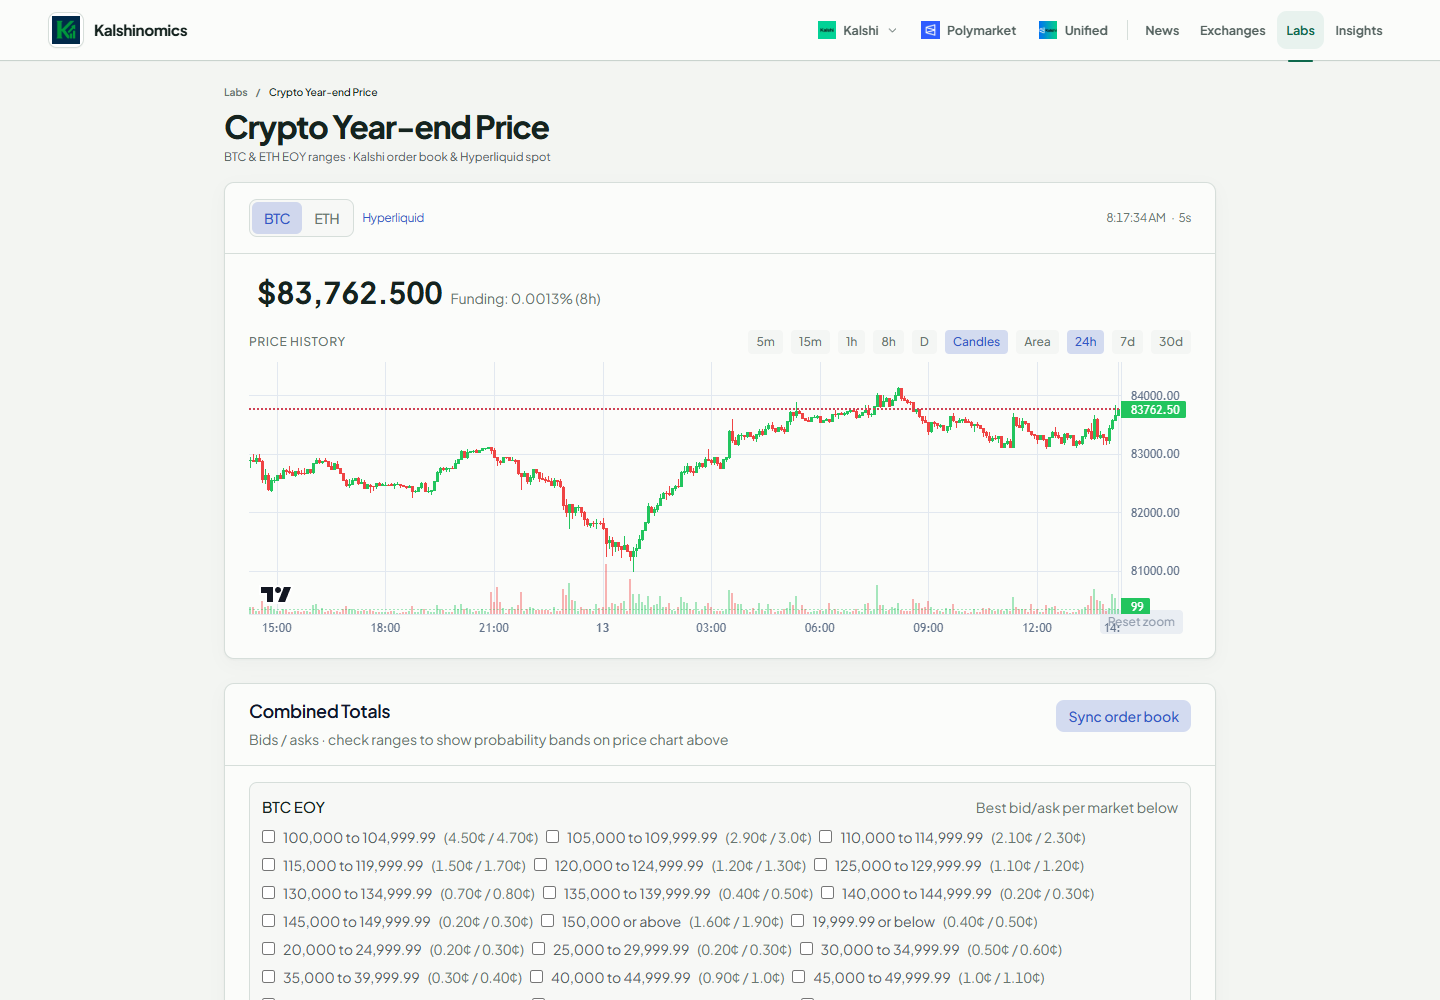
Combined BTC and ETH price history with Kalshi year-end price ranges and order-book totals. Selected ranges could be displayed against the price chart.
View full screenshot ↗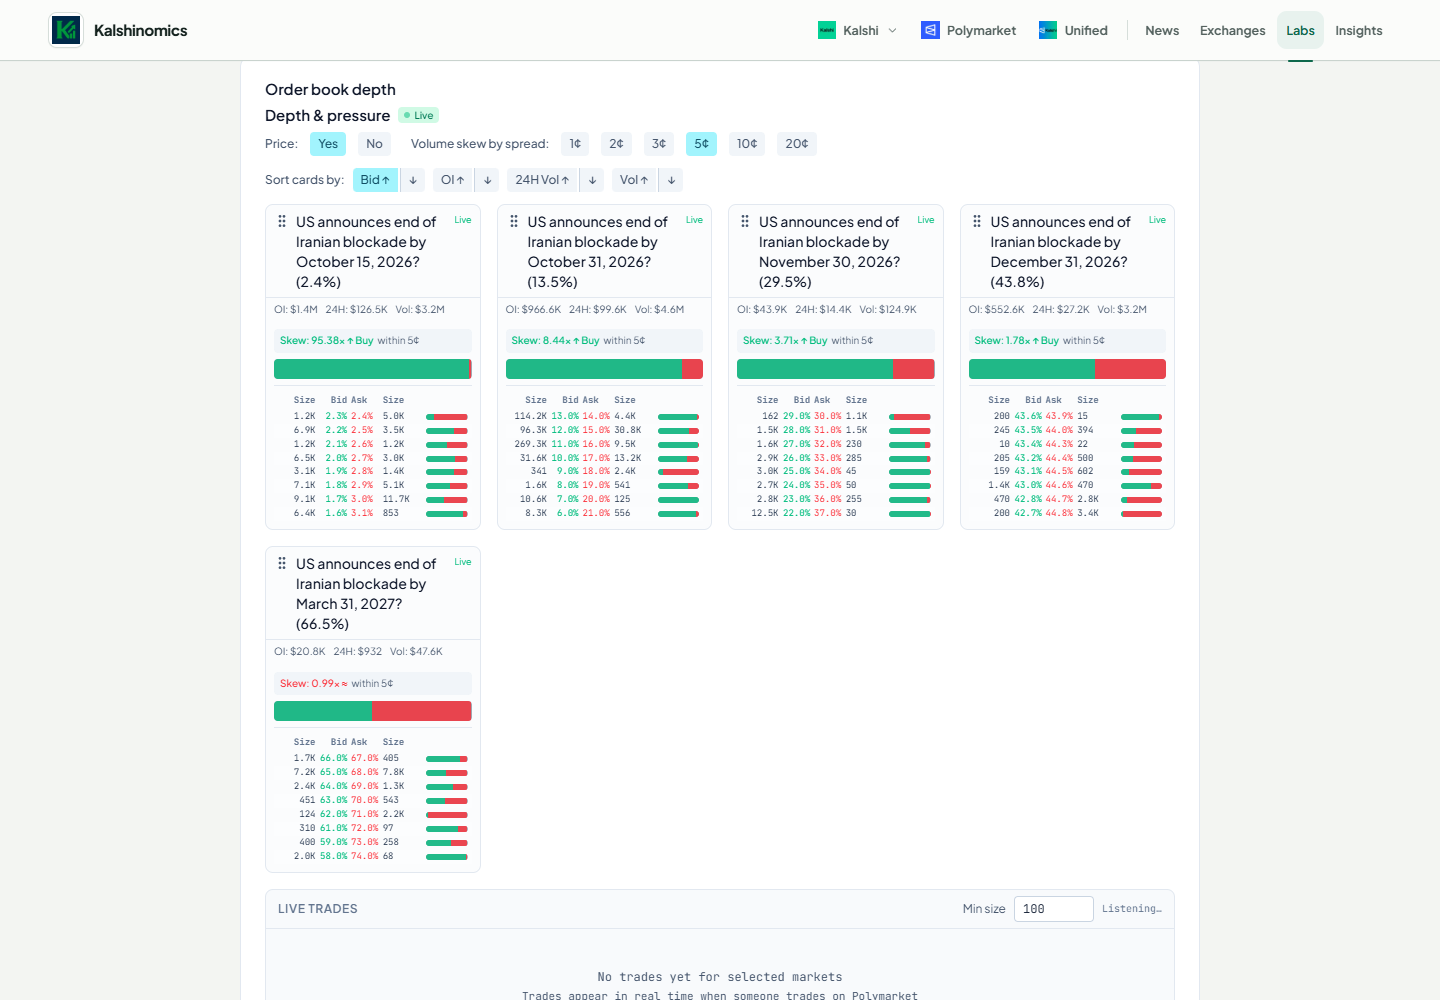
Let users select related geopolitical markets and compare order-book depth, liquidity, and buy/sell pressure instead of looking only at the latest price.
View full screenshot ↗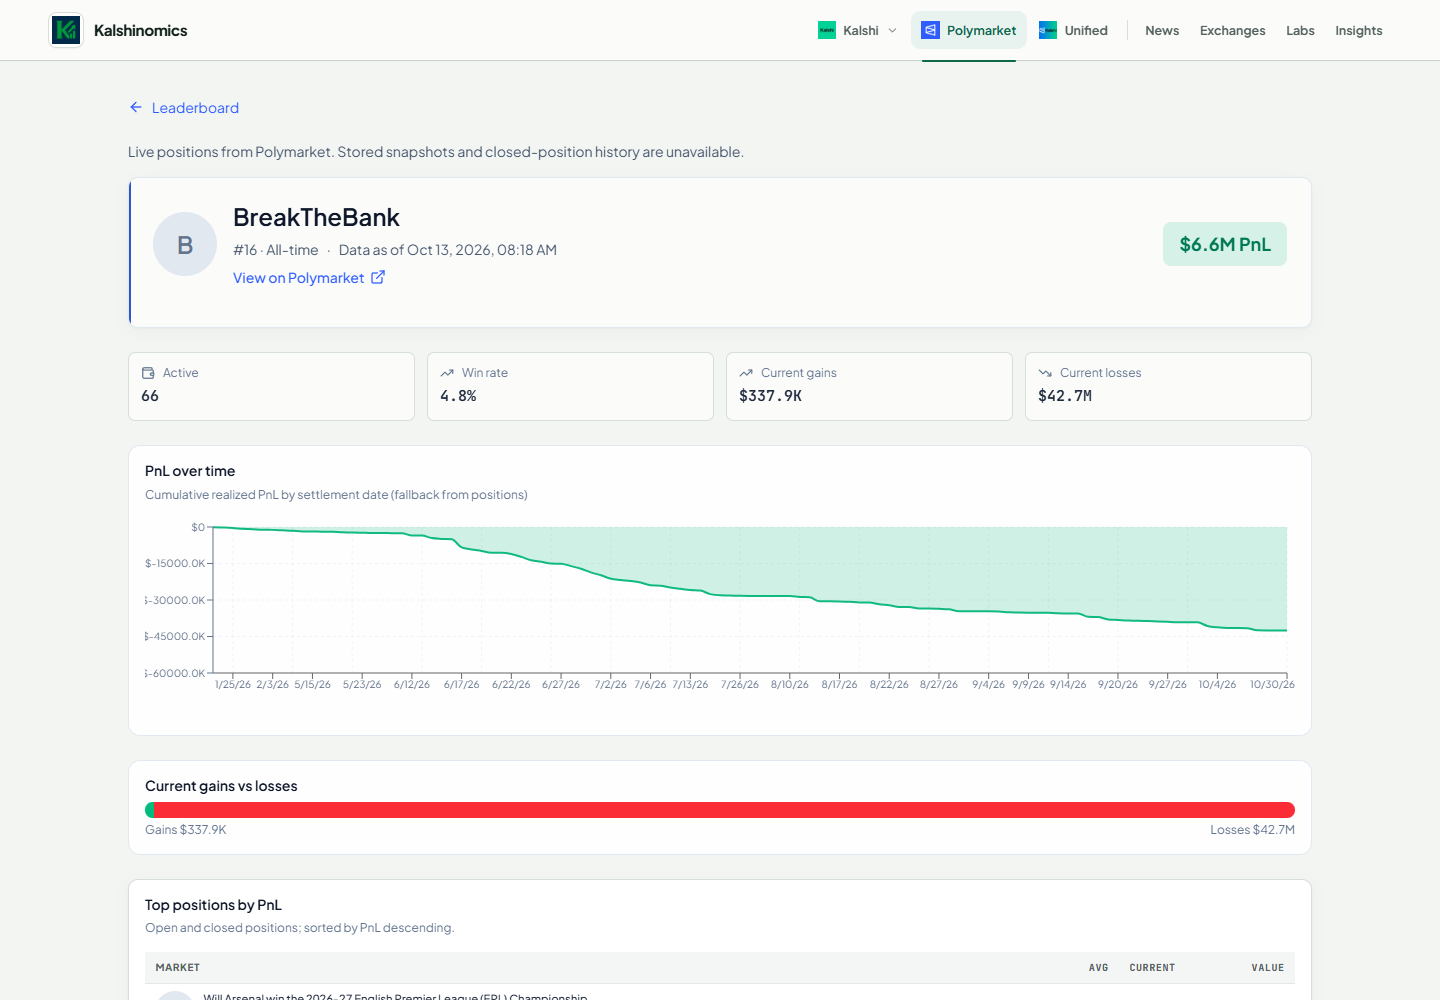
Brought an individual trader’s positions and activity into a research view. It helped users inspect the account behind a leaderboard result.
View full screenshot ↗For commercial inquiries: kalshinomics@gmail.com